Automatic Power Forecasts (Beta)

Examples
Smallest Possible Example
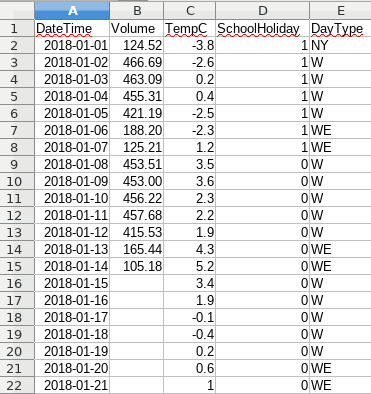
Hourly data
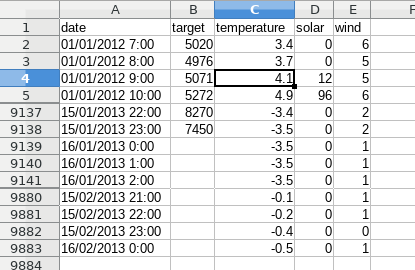
15-minute data
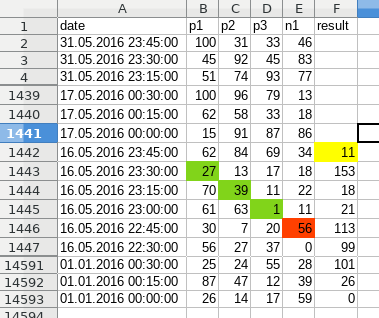
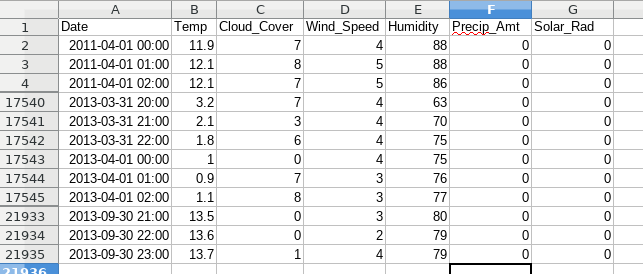
The data is generated following a simple principle: F(t)=B(t-1)+C(t-2)+D(t-3)-E(t-4) as also depicted with colors in the image.
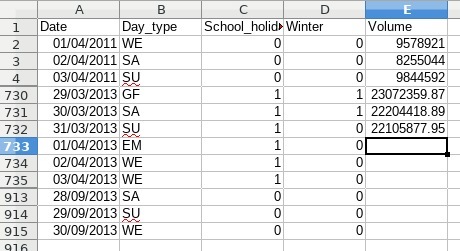
Daily and hourly data
Changelog
- 2019-05-01 Languages supported: EN, DE
- 2019-01-02 Speed and accuracy optimizations
- 2018-11-02 Speed optimizations (up to 50%+)
- 2018-10-31 Added progress bar, strings are now interpreted as category data
- 2018-10-23 Beta launch